Featured Resources & Services

Ask Questions – Get Help
Library Services
Connect to Library WiFi
Library Services

New to Using the Library
Library Services

Accessing Your Library Account
Library Services

Book a Study Room
Library Spaces

Collaborative Commons
Library Spaces

How to Read Call Numbers
Library Collections

Library Instruction
Library Services
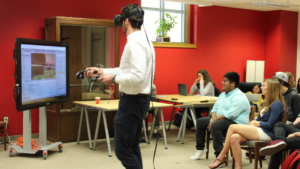
Tech Lending
Library Services